April 12, 2010
Bruce Bueno de Mesquita
Hoover Institution
434 Galvez Mall
Stanford University
Stanford, CA 94305-6010
Phone: 650-723-1754
bdm@hoover.stanford.edu
Dear Bruce Bueno de Mesquita:
I have read Predicting Politics (Bruce Bueno de Mesquita Ohio State University Press, Columbus 2002. In 150 pages there is a lot to think about. It seemed so cheerful as it began. First you demonstrated your method by examining the long term effects of the Concordat of Worms signed in 1122 in which the pope, eager to end the practice of simony, the selling of holy offices, entered into an arrangement with certain kings such that money coming out of a bishopric between the death of a bishop and his replacement would go to the state in which the bishopric lay. It would not be the king’s personal property but would be managed by him on behalf of the state. Apparently it seemed clear that if the funds became the property of the king there would be a great incentive for the king to make delay before agreeing on the new bishop. This reasonable agreement laid the seeds for the modern state, but it took centuries for the events to play themselves out such that the church ceased to be a secular power and could concentrate on saving souls.
Then you showed how democracy was replacing autocracy, everyone was getting richer and since democracies almost never fight democracies there would be very few adjacent autocracies to start wars. It was a cheerful note in a world so often filled with gloom. Then you ran over trouble spots in the world, and there were so many of them it was the same world we all know.
Your method is an application of game theory. If I might be so bold as to oversimplify, it is as if a political process is like a game played at a table. Each player has two down cards face up on the table, one showing his stated desire and the other showing what resources he has to push his desire forward. In his hand he holds cards that represent what kind of deal he might be willing to strike and how much he cares about the issue – what you call salience. He might also have cards representing his assessment of what cards the others have in their hands, but the method does not look that far ahead. Instead, if no deal can be reached from the cards shown, then the members break and confer, dissolving and creating alliances, sounding each other out and so forth. Then they get together again. The method is not deterministic. Each step is a probability function. I gather a lot depends on who confers with whom and in what order. At all events eventually the final deal is reached or a stalemate ensues. What you are able to do is to look at political situations and predict with great accuracy how it will play out and even to a certain extent when.
I like your method and am in broad agreement that it seems valuable. There are two particular points on which I agree with salience.
One point is that politicians are, by and large, experts at what they do. A lot of us regard politics as a clown act. The bright young folks go into academics or science or recently into finance. The politicians sell their faces. But keeping track of so many things about so many actors must require the mind of a master. And I have evidence that it is so; evidence that I doubt you have seen. Here is my favorite graph. I think I shall have it carved on my tombstone.
Information taken from R. H. Carling THE WORLD HISTORY CHART International Timeline Inc. Vienna, VA 1985. The experience of Southern Mesopotamia. The vertical axis is the chance of an empire of any age continuing to rule locally for another 50 years. The horizontal axis is the ages of the empires. I broke the Ottoman Empire into two, because their Janissary elite came from two different sources during the early and late empire.
Elegant, don’t you think? There is all of history up to the 20th century. The chance any empire has of continuing for a couple more generations is a function of its age, and it falls steadily to zero. Now if there were good politicians and lousy politicians, then the graph should trend upward. Those societies that could recruit good ones would survive a long time. Those who recruited duds would die out sooner leaving the more enduring ones with a brighter future on average. But the line never goes up. All societies produce equally excellent negotiators. My stomach writhes for me to write it, but you can’t argue with the numbers.
The second point on which I heartily agree is that politics is predictable. I think the chart bears that out as well. My experience has not been that historians are falling all over themselves gleefully working out the details. You would have thought that they would look at their own numbers. I understand that Isaac Newton looked at this data set and did something rather strange. He got himself made warden of the mint and produced a currency so strong and honest that global trade became almost inevitable. Do you remember the line from Pirates of the Caribbean, “Currency is the currency of the realm”? So it was.
Much as we agree, there is one striking difference in emphasis. You pay little heed to demographics as a driving force in politics. I see just about nothing else. And yet it fits neatly into your model. As the principles sit about that table negotiating, if one represents a country that has a very high birth rate, everybody will know it. It will be a salient point for that country. Those babies simply will have to be allowed for. And it means power for that country, if not at present then in a couple decades when they mature. This is well within the horizon that you describe. People are going to care about it.
The thing that I have noticed about demographics is that small populations, say a couple of hundred in the mating pool, last a long, long time. But if a population is permitted to rise to something like 1,000 then it will crash. And that crash is predictable. There is a 150 year cycle. The second cycle is usually overwhelming, hence the 300 brick wall for southern Mesopotamia.
As you point out, regimes change by crisis. The question I cannot answer is just where along a population decline that crisis is going to happen. It does not seem to happen when the birth rate reaches 1 per woman. That already is about the case in Italy and parts of Spain. When, then? Perhaps it happens when the birth rate goes to zero. In that case we are looking at 30 more years before Western Civilization implodes. A mechanism is easy enough to imagine. With no babies, there are no new parents, no people who are disposed to look to the future or to make sacrifices for the future. Incidentally, or possibly coincidentally, one of Newton’s predictions of the end of the world, by which he would have meant the end of Christendom and the Second Coming, was the year 2040.
But it would be possible to imagine the date as being as late as when the last person born reaches 70 years old. In that case we have along time ago, although not a long time to fix matters. It may already be too late for that.
Here is a clue. This is the Easter Island experience.
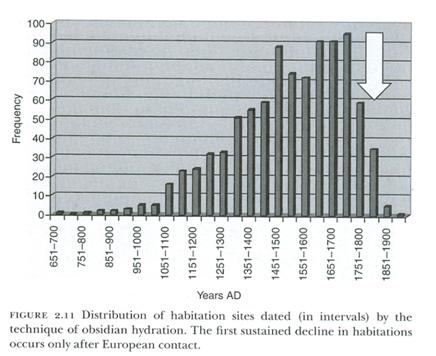
Chapter 2 Terry L. Hunt and Carl P. Lipo ”Ecological Catastrophe, Collapse, and the Myth of “Ecocide” on Rapa Nui,” Questioning Collapse, Cambridge University Press, Cambridge 2010. Dates are on the horizontal axis. The number of occupied dwellings is on the vertical axis.
As you see, the time from typical little village to collapse is about 600 years. The dread 300 year cycle is visible as a notch. The 150 year cycle is not visible. The authors attribute the final plunge to the arrival of Europeans, marked by the white arrow. I do not see any effect at that point. The final drop is already established. They are dying out of infertility. The rate of fall seems to be about a third every 50 years. So let us make a few guesses. Assume that absent modern conveniences a person will be hard pressed to keep up an independent life much past age 50. So let us guess that the fall in the number of dwellings represents the rate at which people are reaching 50. That would mean that, keep me honest on this as I’m not so sure, the birth rate fifty years before the precipitous drop was a bit over one per woman.
And there was a crisis during those years. The first Europeans found the iconic Easter Island statues all standing tall and proud. The next visitors found them all tipped over. Thor Heyerdahl spoke with the people there and was told that the statues represented families, and people had been pushing each others’ statues over out of spite. They also were accusing each other of cannibalism. That should be enough of a crisis.
But I am not sure of my numbers at all, neither birth rates nor exactly when the bad times happened.
So there is a challenge for you. Unlike most historians, you do look for patterns, and unlike almost anybody else, you take the long view. Figure out how population decline mates up with political instability. I think you have the tools. Suitably warned we might do something.
I intend eventually to post this letter along with others on my website NoBabies.net. If you would like more evidence go there and look at the March 25, 2010 entry or go to http://nobabies.net/Albuquerque%20poster.html . I think there is enough there to establish the principle beyond a shadow of a doubt. There is more evidence elsewhere on the site, and of course I am available to clarify further or help in any way I can. Please let me know what you think.
Sincerely,
M. Linton Herbert MD
There have been 3.989 visitors so far.